The results of the Geophysical surveys are well summarized and discussed in the MSc thesis of Hannes Pilser (see the section of publications).
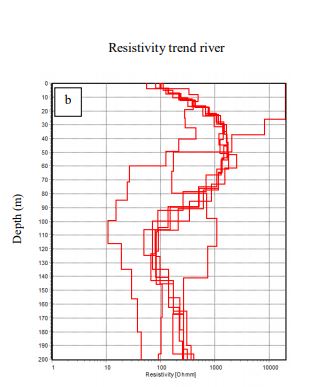
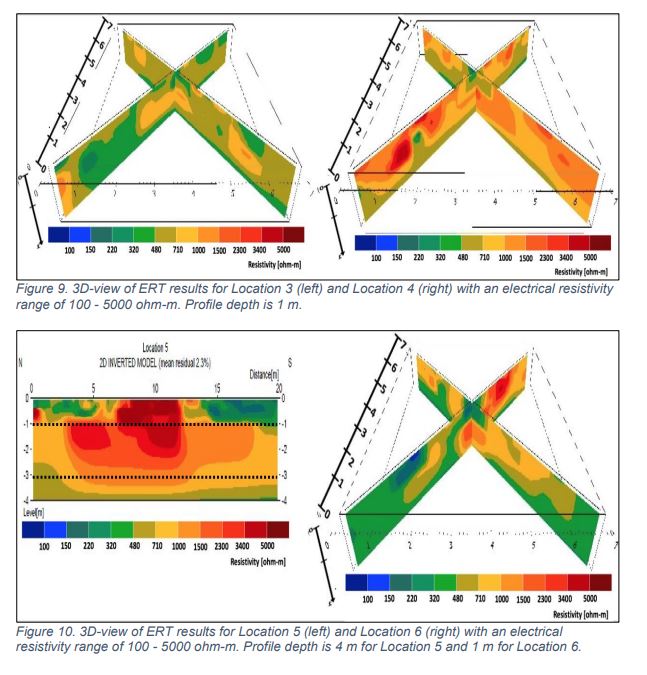
There is general trend of increasing resistivity towards the deeper layers, as it can be seen in the following figure:
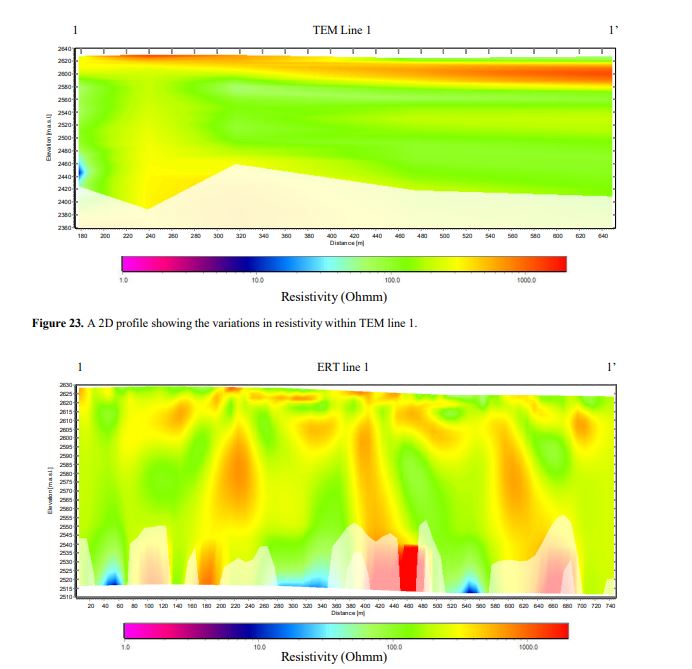
When comparted ERT profiles with those generated from TEM soundings, there is generally a good agreement between them. However, due to bad electrode contact during ERT surveys the results from these surveys shows abnormal high resistivity values on top of each ERT profile. On the contrary the TEM sounding do not have this kind of problems, therefore TEM sounding are more promising in these type of soils.
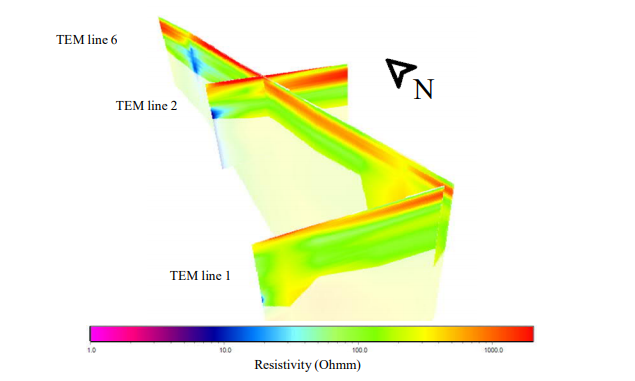
From the geophysical surveys it will be possible to propose and refine the hydrogeological conceptual models. 3D diagrams of resistivity distribution can be constructed therefore they can be used to generate more accurate conceptual models.
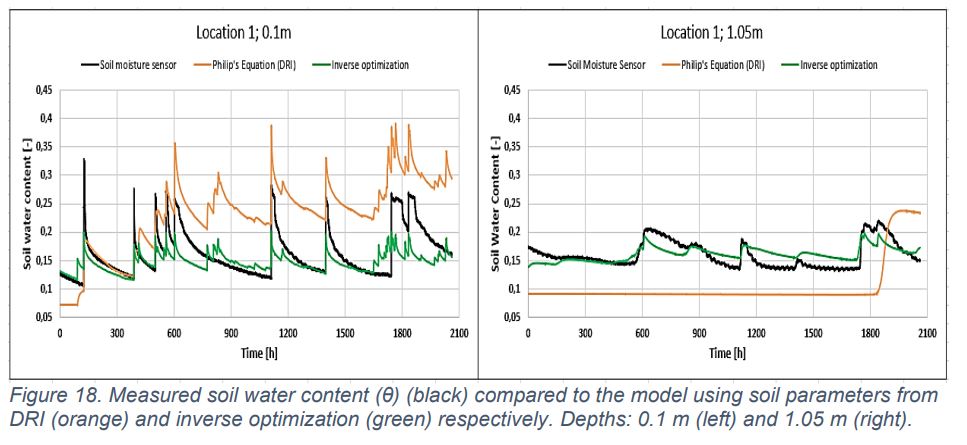
One last output from these study was the 1D modelling of rainfall infiltration by using Hydrus 1D. This was part of the thesis of Alex Bergman and Mire Persmark (ssee the section of publications). In order to model how water infiltrates into the soil, it is needed to have the layering description of the subsoil and its properties. ERT profiles were performed in order to characterize the subsoil profile:
Soil moisture sensors at different depth level were installed, and information about soil moisture contents were obtained. The modelling in Hydrus shows a good agreement between the observed and the model values. This kind of exercises will be useful for macro water balances, and for assessing if there is groundwater recharge from precipitation.